In the last post, I was seeing if Perch embeddings produced from less-confident predictions of the humpback detector model produced easy-to-differentiate PCA clusters. While there was some obvious grouping, the embeddings didn’t appear to provide clear visual clusters of whale and non-whale clips.
But maybe we just needed more data. That last plot just used 20 clip embeddings. So let’s plot 100 likely-positive and 100 likely-negative one instead.
Here’s the PCA plot:
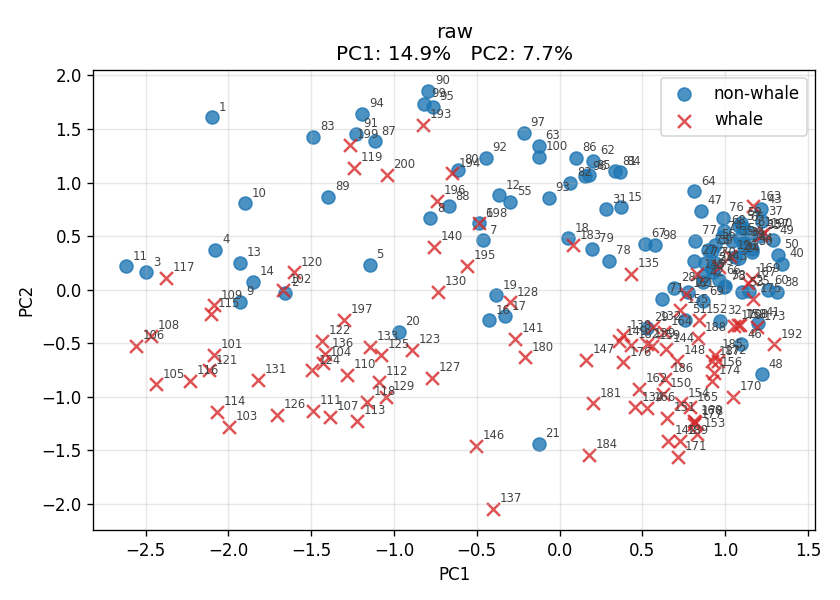
That’s showing much less obvious separation than I expected. Before trying some manual nearest-neighbor testing, I’ll drop the embeddings into a UMAP plot (cosine similarity, n_neighbors=15) to see if it can find any obvious structure:
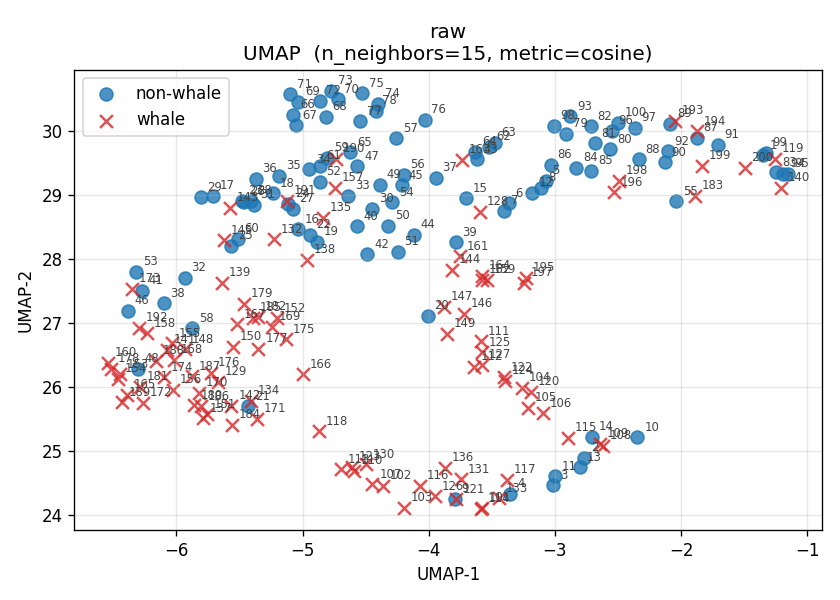
Well, yes. And no. It’s definitely showing a bit more organization in the embedding space, but there are some interesting overlaps.
Simple low-dimensional projections may not be the best tool for assessing the ability of Perch embeddings to distinguish between whale and non-whale. Let’s listen to examples from a few apparent groupings and their nearest neighbors in embedding space using cosine similarity.
We’ll start with something that looks to be in a fairly well-defined positive group, in the lower center of that UMAP plot. Here’s clip 130, which the humpback detector’s model put in the higher-confidence bucket:
That’s a positive, if a bit noisy. Now let’s compute the nearest neighbors of clip 130, which turn out to be 123, 110, 12, 6, and 5. It’s notable that those last three are nowhere near 130 in the UMAP plot, and only reasonably close by in the PCA plot. The implication here is that we’re losing a significant amount of information in the 2D projections.
It’s also worth noting that the first two closest neighbors are in the humpback detector’s higher-confidence bucket, but the last three are in the lower-confidence one.
Here are the clips:
Easy positive.
Fairly easy positive.
There might be something in the last half-second of that clip, but I’m inclined to lean negative.
Definitely something in the last half-second of that one. Leaning positive.
This one sounds to me like a negative.
In this case, the closest neighbors to a noisy positive clip seem fairly evenly split between positives and negatives, without any immediately obvious whale-specific features.
Moving on to one in an apparent strong non-whale cluster in the UMAP plot: clip 73, at the top of the plot.
A definite negative, with a continuous, low, pulsing sound (a ship engine?)
Moving on to its nearest neighbors–these are all low-confidence clips from the detector: 72, 75, 69, 57, 30.
Very similar to clip 73.
Same as the last one.
Same overall sound profile as the last two, but there might be a positive in seconds 1 and 2.
If there’s something there, it’s not completely breaking through the noise.
Again, it’s not hard to hear something there, but overall I’d call this a negative.
A few interesting points here:
- The cosine similarities of these embeddings are quite high.
- The first three neighbor clips, along with the central clip, are all within the same 10-minute time period. Not unexpectedly, they share some obvious sound features.
At least for these raw, noisy, mid-confidence MBARI clips, in these tests, the Perch embeddings don’t seem to be organizing these clips into obvious whale/non-whale structures. They may instead be indexing on other meaningful acoustic structure.